Code
from pathlib import Path

import numpy as np
import pandas as pd
import plotly.express as px
from IPython.display import Image, IFrame, Markdown, displayTeam JobInsights (Michael Nair & Soumit S Rahman) is investigating how the quality of regulations—both on the books and in day-to-day firm experiences—shapes total factor productivity (TFP), formalization, and job creation. This notebook serves as the analytical companion to our NextJs application described in project.md, grounding the story in transparent, reproducible code.
from pathlib import Path
import numpy as np
import pandas as pd
import plotly.express as px
from IPython.display import Image, IFrame, Markdown, display# Load cleaned data
print()
Pillar_path = 'DataDive25/Team_Projects/challenge_2/cleaned_data/Merged_TFP_and_BReady_2024.csv'
print(f"path to Merged_TFP_and_BReady_2024.csv: {Pillar_path}")
tfp_pillar_df = pd.read_csv(Pillar_path)
TopicScores_path = 'DataDive25/Team_Projects/challenge_2/cleaned_data/Merged_TFP_and_TopicScores_2024.csv'
print(f"path to Merged_TFP_and_TopicScores_2024.csv: {TopicScores_path}")
tfp_topic_scores_df = pd.read_csv(TopicScores_path)
path to Merged_TFP_and_BReady_2024.csv: /Users/michaelnair/Desktop/world-bank-hackathon/DataDive25/Team_Projects/challenge_2/cleaned_data/Merged_TFP_and_BReady_2024.csv
path to Merged_TFP_and_TopicScores_2024.csv: /Users/michaelnair/Desktop/world-bank-hackathon/DataDive25/Team_Projects/challenge_2/cleaned_data/Merged_TFP_and_TopicScores_2024.csv# scatter plot comparing the 3 pillar types
pillar_fig = px.scatter_3d(
tfp_pillar_df,
x="Pillar_3_Operational_Efficiency",
y="Pillar_2_Public_Services",
z="Pillar_1_Regulatory_Framework",
color="tfp_avg",
color_continuous_scale="Viridis",
hover_name="country_official",
hover_data={
"Pillar_3_Operational_Efficiency": True,
"Pillar_2_Public_Services": True,
"Pillar_1_Regulatory_Framework": True,
"tfp_avg": ":.3f",
"max_year": True,
},
title="TFP and B-Ready Pillars (3D view)",
)
pillar_fig.update_layout(
scene=dict(
xaxis_title="Operational Efficiency",
yaxis_title="Public Services",
zaxis_title="Regulatory Framework",
),
coloraxis_colorbar=dict(title="Average TFP"),
)
output_dir = Path.cwd() / "DataDive25/Team_Projects/challenge_2/outputs"
output_dir.mkdir(parents=True, exist_ok=True)
html_path = output_dir / "pillar_regulation_tfp_scatter_3d.html"
pillar_fig.write_html(html_path, include_plotlyjs="cdn")
pillar_fig.show()Unable to display output for mime type(s): application/vnd.plotly.v1+json# Figure 1 – TFP vs. B-Ready pillars
pillars_img = Path(
"/Users/michaelnair/Desktop/world-bank-hackathon/DataDive25/Team_Projects/challenge_2/images/TFP_vs_Pillars_Plot.png"
)
if pillars_img.exists():
display(Image(filename=str(pillars_img), embed=True))
display(
Markdown(
"**What this shows:** Each dot is a country plotted across the three B-Ready pillar scores, with color representing average TFP. Clusters highlight which regulatory pillar is most binding relative to peers."
)
)
else:
print(f"Missing image: {pillars_img}")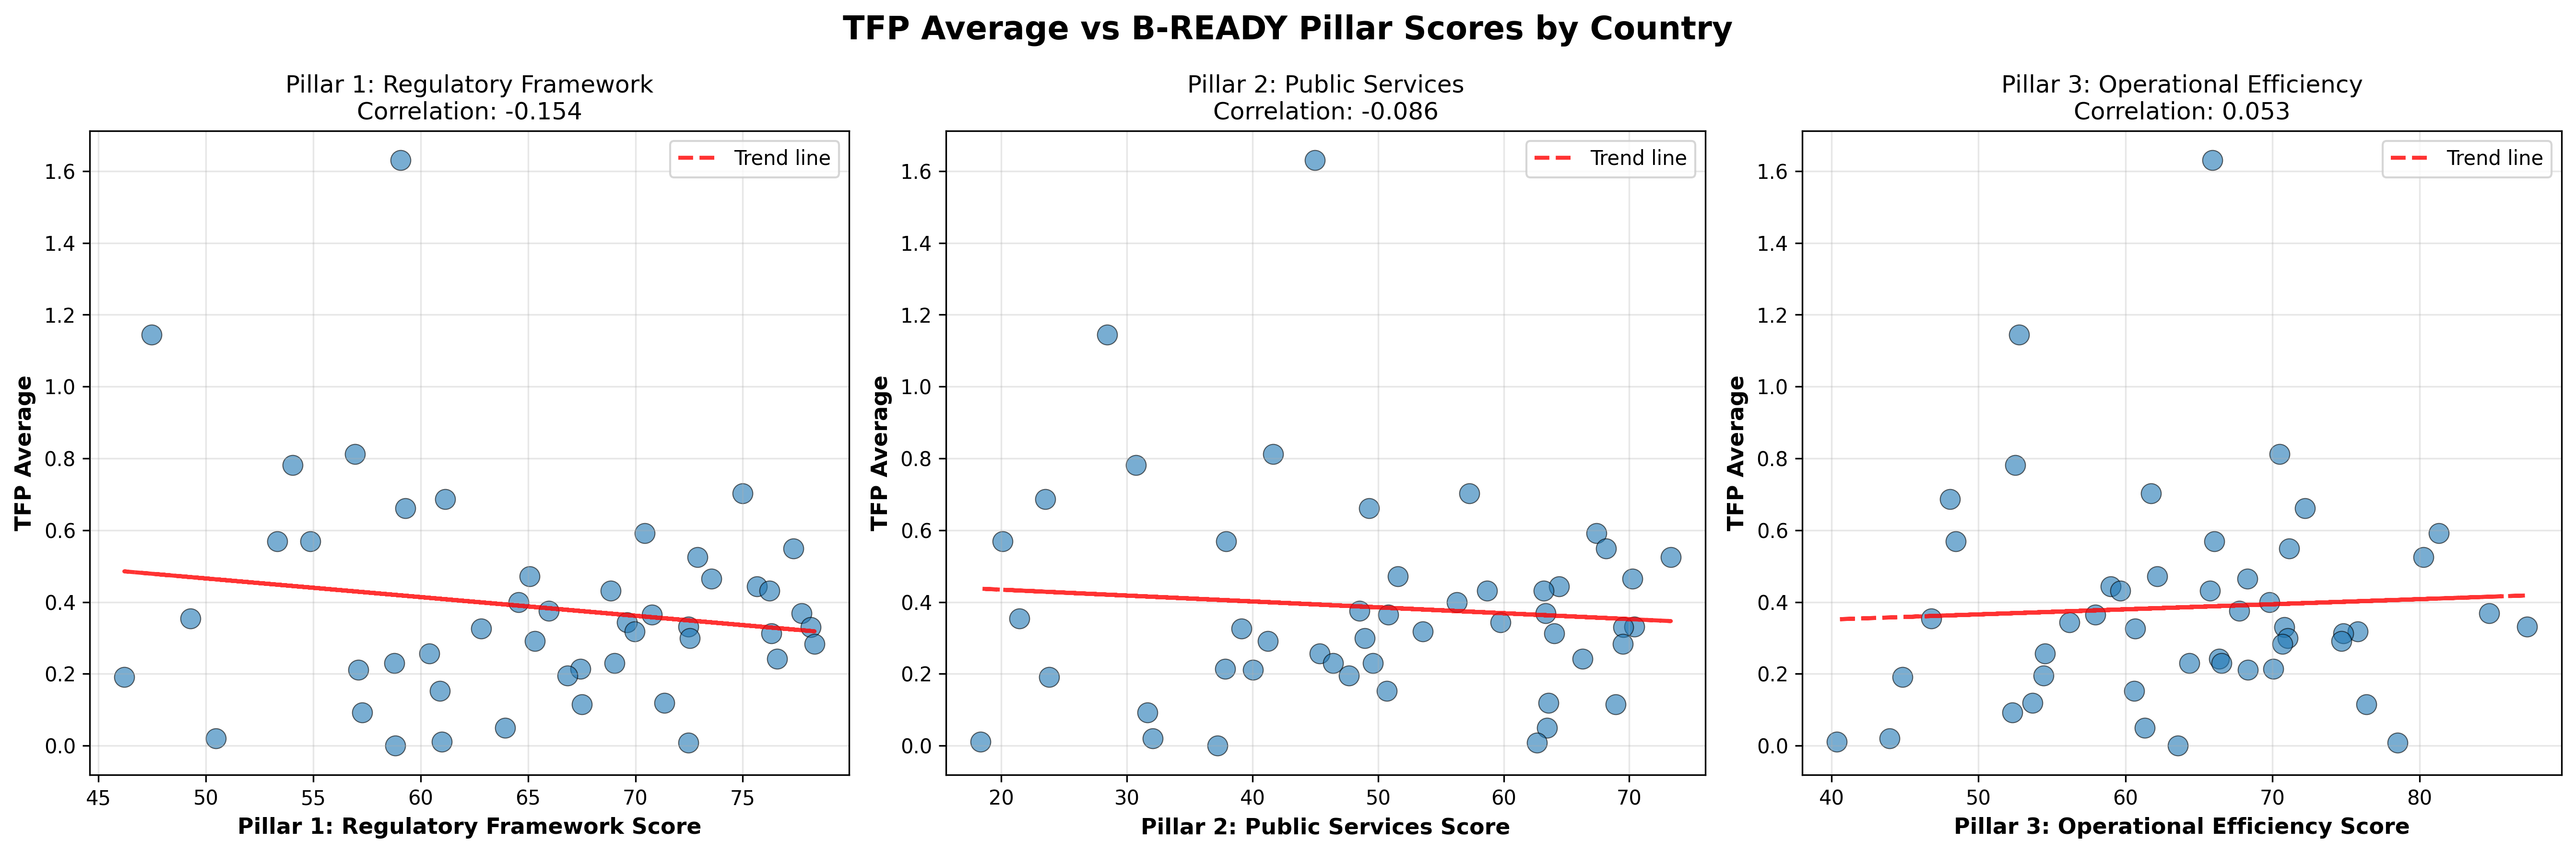
What this shows: Each dot is a country plotted across the three B-Ready pillar scores, with color representing average TFP. Clusters highlight which regulatory pillar is most binding relative to peers.
# Figure 2 – TFP vs. topic clusters
topics_img = Path(
    "/Users/michaelnair/Desktop/world-bank-hackathon/DataDive25/Team_Projects/challenge_2/images/TFP_vs_Topics_Plot.png"
)

if topics_img.exists():
    display(Image(filename=str(topics_img), embed=True))
    display(
        Markdown(
            "**What this shows:** Topic scores unpack the pillars into specific regulatory frictions (permits, electricity, tax morale, skills). The overlay with TFP surfaces which bottlenecks line up with lagging productivity."
        )
    )
else:
    print(f"Missing image: {topics_img}")
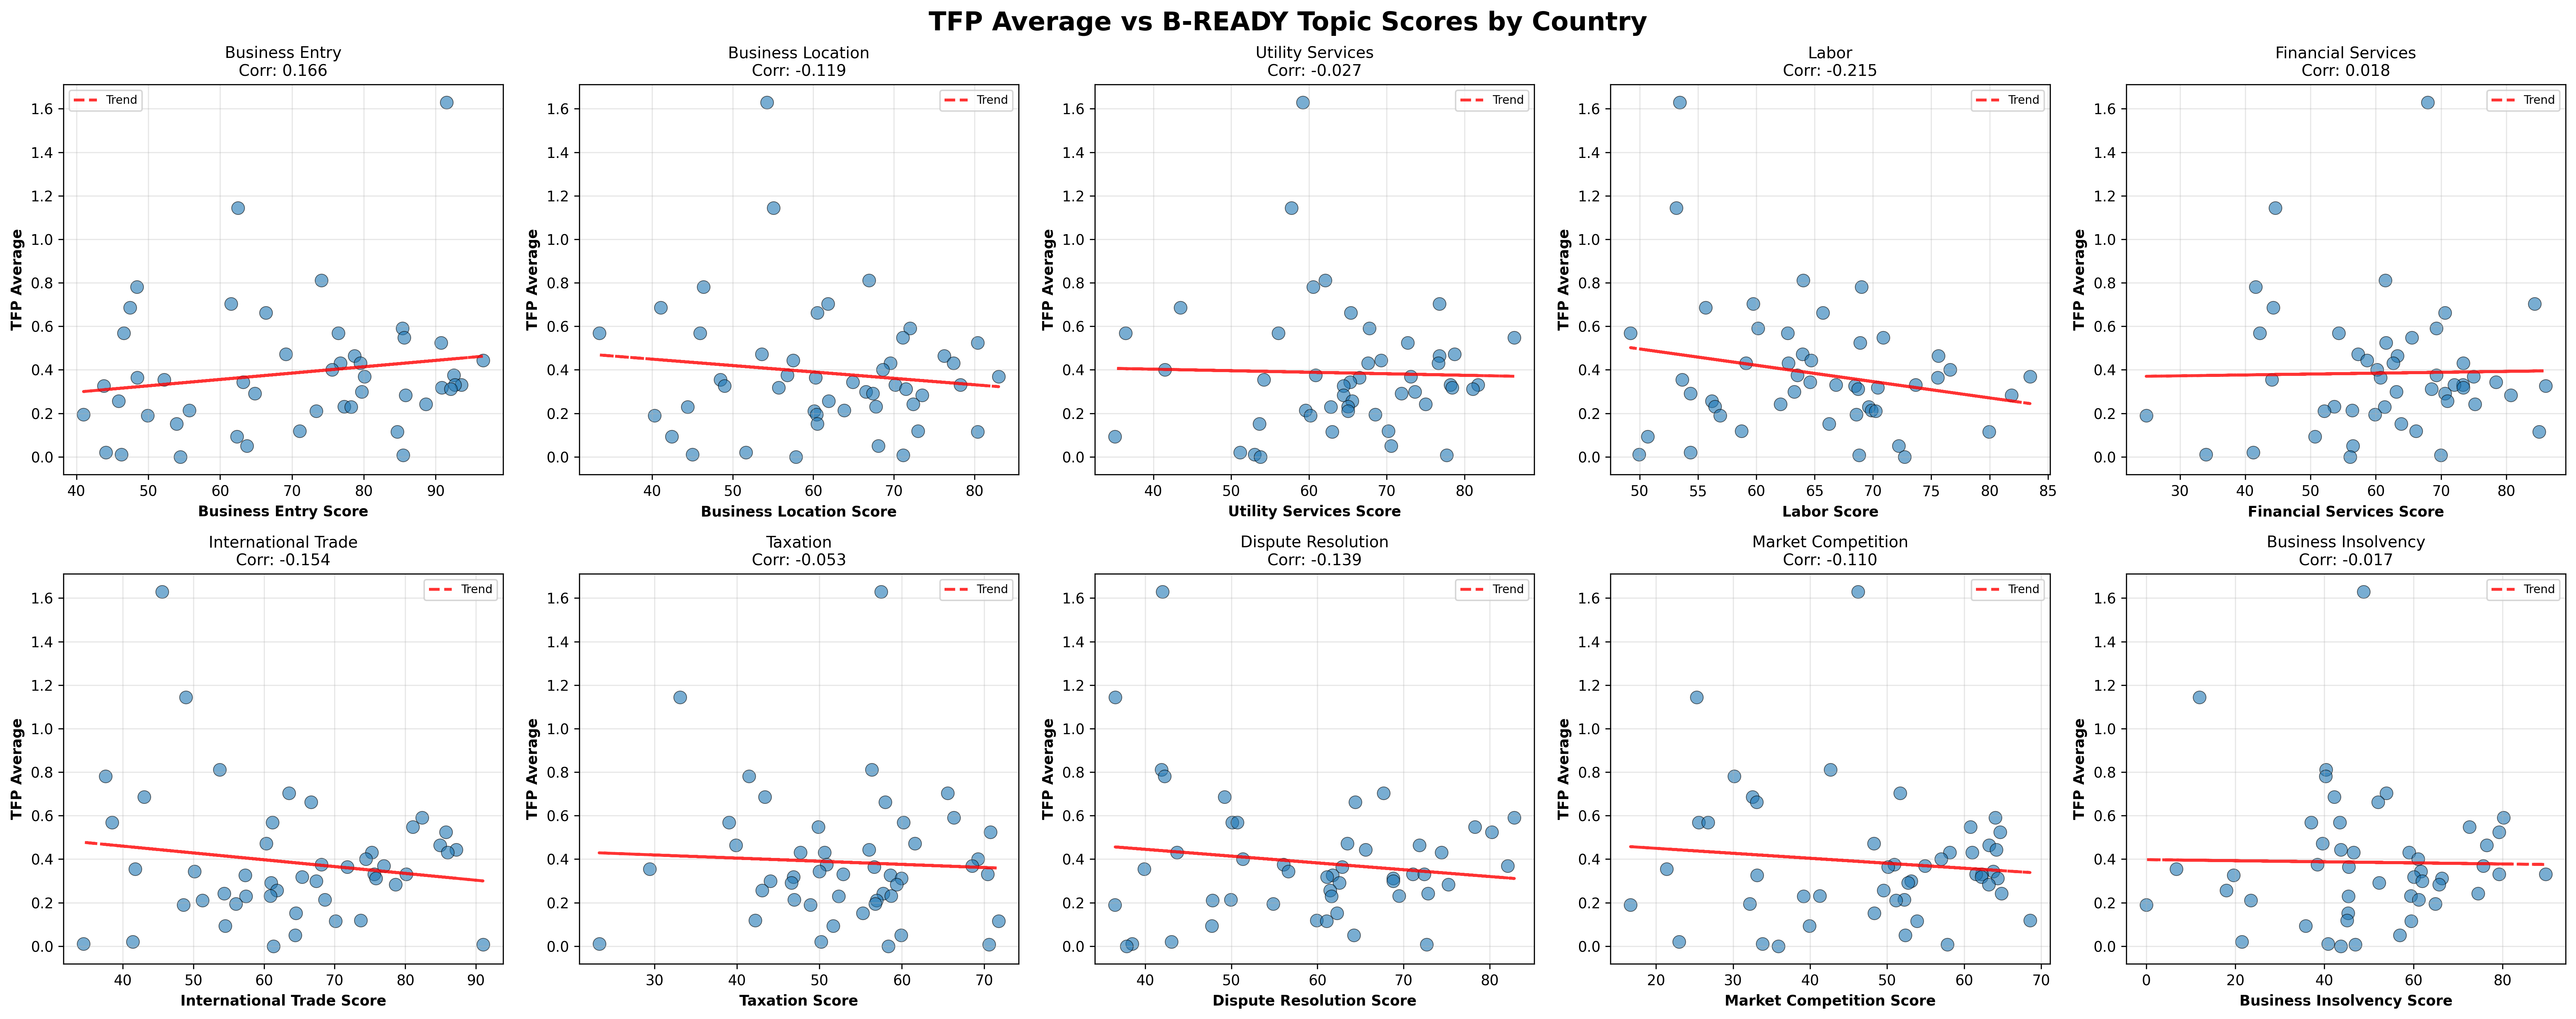
What this shows: Topic scores unpack the pillars into specific regulatory frictions (permits, electricity, tax morale, skills). The overlay with TFP surfaces which bottlenecks line up with lagging productivity.
# Figure 2 – scatter plot comparing the 3 pillar types
topics_img = Path(
    "/Users/michaelnair/Desktop/world-bank-hackathon/DataDive25/Team_Projects/challenge_2/images/TFP and B-Ready Pillars.png"
)

if topics_img.exists():
    display(Image(filename=str(topics_img), embed=True))
    display(
        Markdown(
            "**What this shows:** Topic scores unpack the pillars into specific regulatory frictions (permits, electricity, tax morale, skills). The overlay with TFP surfaces which bottlenecks line up with lagging productivity."
        )
    )
else:
    print(f"Missing image: {topics_img}")
What this shows: Topic scores unpack the pillars into specific regulatory frictions (permits, electricity, tax morale, skills). The overlay with TFP surfaces which bottlenecks line up with lagging productivity.
# Figure 4 – 3d plot comparing pillar and topic to TFP
topics_img = Path(
    "/Users/michaelnair/Desktop/world-bank-hackathon/DataDive25/Team_Projects/challenge_2/images/topic and pillar vs TFP.png"
)

if topics_img.exists():
    display(Image(filename=str(topics_img), embed=True))
    display(
        Markdown(
            "**What this shows:** Topic scores unpack the pillars into specific regulatory frictions (permits, electricity, tax morale, skills). The overlay with TFP surfaces which bottlenecks line up with lagging productivity."
        )
    )
else:
    print(f"Missing image: {topics_img}")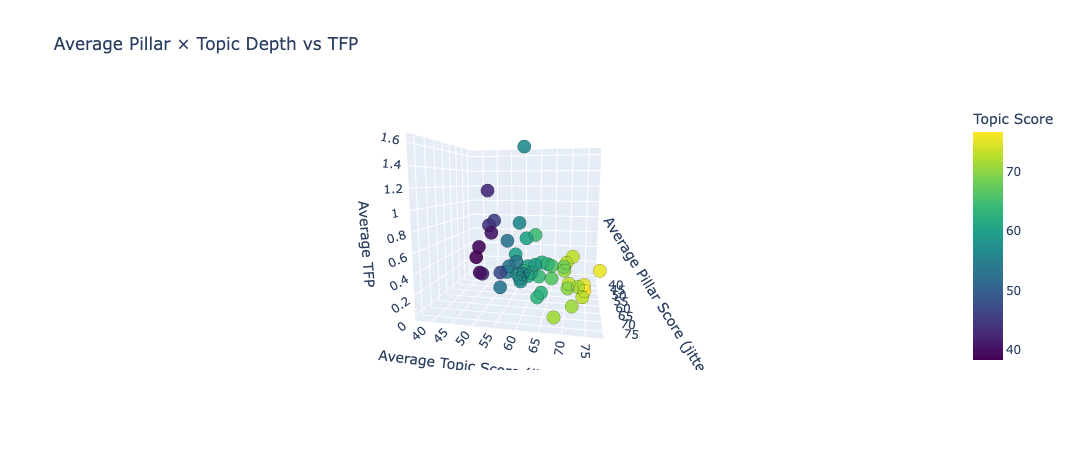
What this shows: Topic scores unpack the pillars into specific regulatory frictions (permits, electricity, tax morale, skills). The overlay with TFP surfaces which bottlenecks line up with lagging productivity.
# 3d plot comparing pillar and topic to TFP

# Merge pillar and topic datasets on country_official
merged_df = tfp_pillar_df.merge(
    tfp_topic_scores_df,
    on="country_official",
    how="inner",
    suffixes=("_pillar", "_topic"),
)

print(f"Merged rows: {merged_df.shape[0]} | Columns: {merged_df.shape[1]}")
merged_df.head(10)

# create 3d plot
pillar_cols = [
    "Pillar_1_Regulatory_Framework",
    "Pillar_2_Public_Services",
    "Pillar_3_Operational_Efficiency",
]
topic_cols = [
    "Business_Entry_Overall",
    "Business_Location_Overall",
    "Utility_Services_Overall",
    "Labor_Overall",
    "Financial_Services_Overall",
    "International_Trade_Overall",
    "Taxation_Overall",
    "Dispute_Resolution_Overall",
    "Market_Competition_Overall",
    "Business_Insolvency_Overall",
]
merged_df["pillar_score_mean"] = merged_df[pillar_cols].mean(axis=1)
merged_df["topic_score_mean"] = merged_df[topic_cols].mean(axis=1)

rng = np.random.default_rng(42)
jitter_scale = 2
merged_df["pillar_score_plot"] = (
    merged_df["pillar_score_mean"]
    + rng.normal(0, jitter_scale, size=len(merged_df))
).clip(lower=0, upper=100)
merged_df["topic_score_plot"] = (
    merged_df["topic_score_mean"]
    + rng.normal(0, jitter_scale, size=len(merged_df))
).clip(lower=0, upper=100)

pillar_topic_fig = px.scatter_3d(
    merged_df,
    x="pillar_score_plot",
    y="topic_score_plot",
    z="tfp_avg_pillar",
    color="topic_score_mean",
    color_continuous_scale="Viridis",
    hover_name="country_official",
    hover_data={
        "pillar_score_mean": ":.2f",
        "topic_score_mean": ":.2f",
        "tfp_avg_pillar": ":.3f",
        "Pillar_1_Regulatory_Framework": True,
        "Business_Entry_Overall": True,
    },
    title="Average Pillar × Topic Depth vs TFP",
)

pillar_topic_fig.update_traces(
    marker=dict(size=7.5, opacity=0.9, line=dict(width=0.4, color="rgba(0,0,0,0.4)"))
)

pillar_topic_fig.update_layout(
    scene=dict(
        xaxis_title="Average Pillar Score (jittered)",
        yaxis_title="Average Topic Score (jittered)",
        zaxis_title="Average TFP",
    ),
    coloraxis_colorbar=dict(title="Topic Score"),
)

topic_html = output_dir / "pillar_topic_tfp_scatter_3d.html"
pillar_topic_fig.write_html(topic_html, include_plotlyjs="cdn")
pillar_topic_fig.show()
Merged rows: 48 | Columns: 24Unable to display output for mime type(s): application/vnd.plotly.v1+jsonhttps://docs.google.com/spreadsheets/d/15mnv-AkGdBbtIghMVxjmkGHmRfhNcpiM-mQ0C-3Ypdc/edit?pli=1&gid=576923710#gid=576923710